
Image Processing For Thermal Camera
Introduction
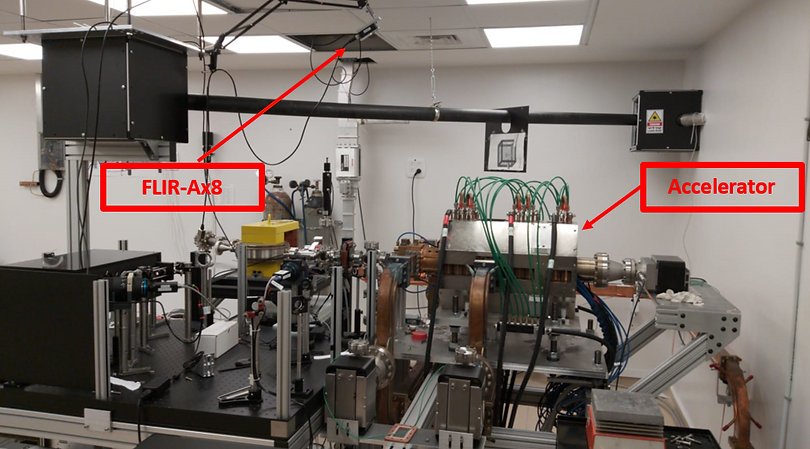
During the FEL-THz accelerator operation at Ariel University, hazardous ionizing radiation is emitted.
In addition accelerator's overheat can create research errors and even damage the accelerator itself.
Therefore, there is a need to develop a control and diagnostic system that will monitor the heat levels in the accelerator at any given moment and alert the user in the event of an abnormal temperature exceeding 50 ° C.
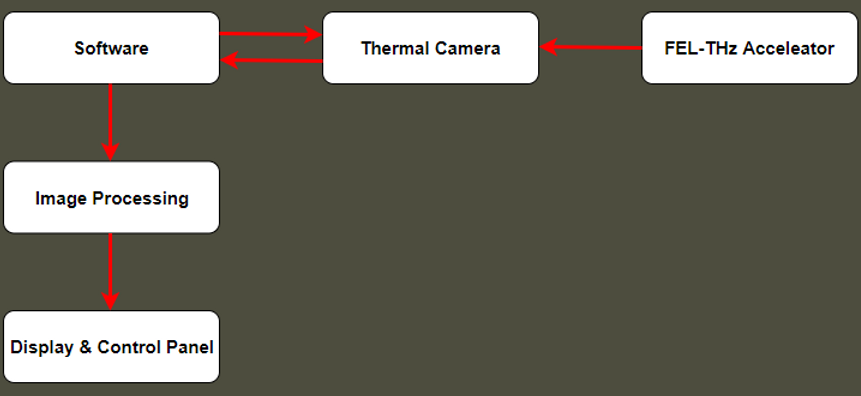
For this purpose, a FLIR-Ax8 thermal camera was purchased which will be located in the accelerator room and operated from the control room by an image processing algorithm in LabVIEW development environment.
The system will alert the user by voice and visual alert, photograph and save the thermal image and record the image data in a CSV file.
Project's Softwares


Heat And Electromagnetic Radiation
-
With the IR sensor in the thermal camera, the accelerator temperature can be estimated based on the electromagnetic radiation emitted by it.
-
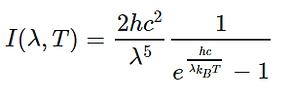
The temperature translation is made possible by detecting the wavelength at the maximum intensity of the radiation emitted by Planck's law.
-
Planck Law - describes the relationship between the intensity of radiation and the wavelength emittedby the accelerator in certain temperature.

FLIR-Ax8 Thermal camera
-
The camera sensor is built from Uncooled micro-bolometer detector that makes up the camera's IR resolution in 80x60 pixel.
-
Each pixel in the array has resistance, which changes as a result of the heat generated by the radiation hit, Therefore the voltage level at each pixel varies with the radiation absorbed.
-
The analog voltage levels go through A/D Converted and presented as a thermal image, so that each voltage level is associated with a certain color in the color scale.
-
The camera sensor is capable of absorbing IR radiation at wavelengths which range from 7.5-13 um in the longwave infrared area.
-
The communication between the camera and the computer is done through the local area network, where the type of communication is according to the Ethernet standard.
-
This project uses Get/Post requeststhe of HTTP protocol to communicate between the camera and LabVIEW software.
-
Technical data:
-
Image resolution: 640 × 480.
-
Temperature range: –10 ° C to + 150 ° C (14 ° F to 302 ° F).
-
Error - ± 2 ° C.
-
JPEG image format.
-


Image Processing
-
The received image does not contain radiometric data and therefore image processing is required.
-
The image mapping is done by adjusting temperature values to the color values that received from the thermal image.
This color represent the highest Temp


This color represent the lowest Temp

System Structure
LabVIEW Sub-Vis
-
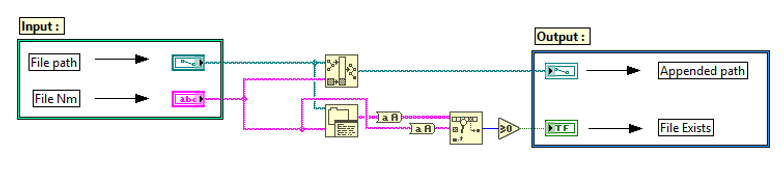
File Exist - Check the existence of a file in a folder
-
Login - Perform communication with FLIR-Ax8 Cmara interface.

-
Image Path & Name - Providing a file name and address.

-
Slide - Design the temperature bar in the display window.

-
Take Picture - Photo taken by the user.
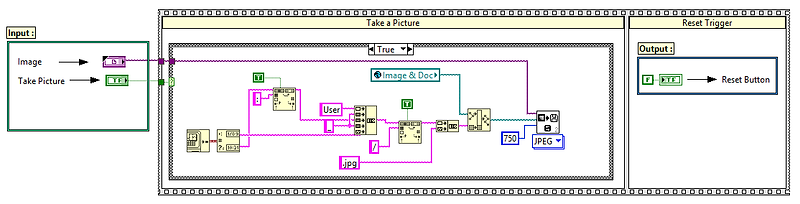
-
Server Image Data - Interprets the pixel map levels of the thermal image.

-
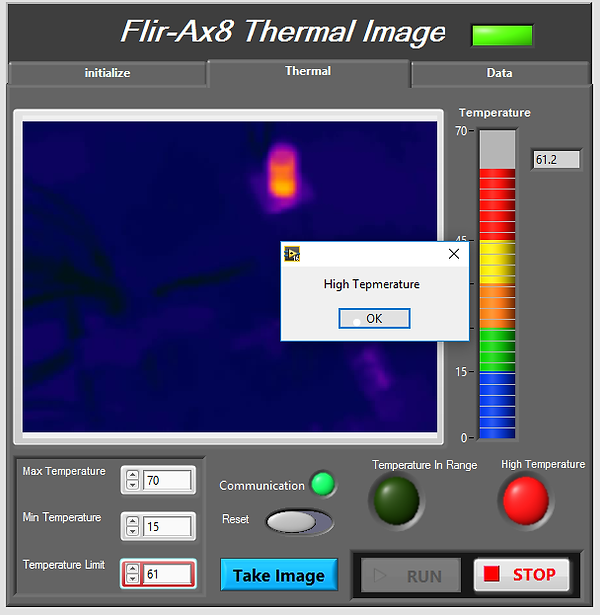
Save Image & Message - Save the thermal image and pop up a warning window.


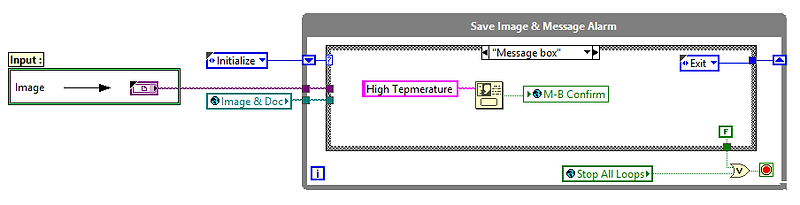

-
Documentation - Record the status data in which the thermal image was taken.


-
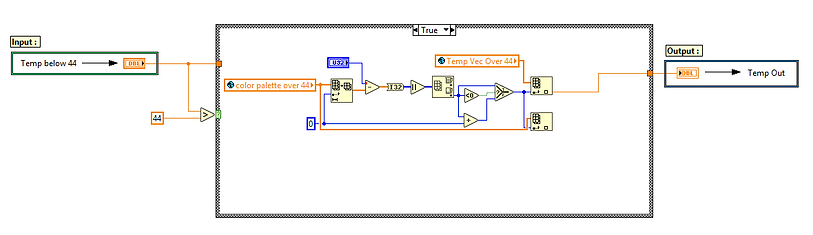
Color Palette To Temperature Vector - Mapping image colors.

-
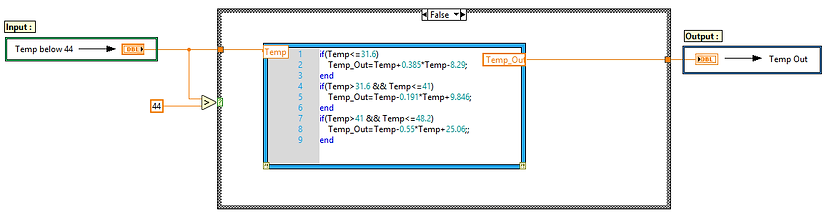
Color To Temperature Function - Processing the image and calculating the temperature value.

-
Notification by Reference - Control the flashing lights and reset button in the display window.

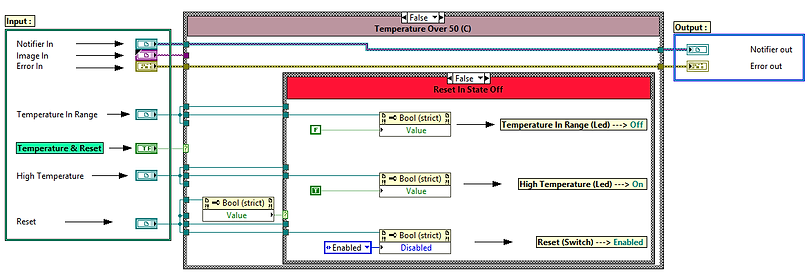
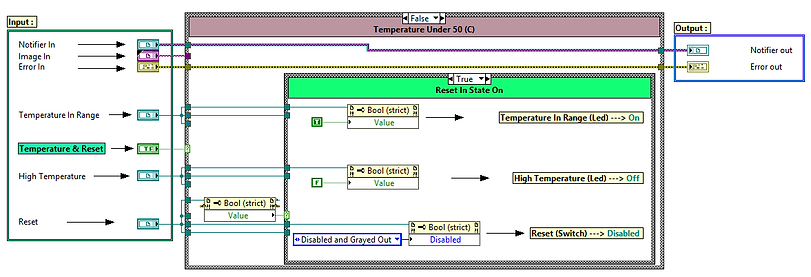
-
Alarm Function - Alarm sounding at an abnormal temperature

-
Calibration - Perform system error correction.
-
Palette & Temp Vector - New mapping for 44-62 degree temperature range.

LabVIEW Main-Vi

-
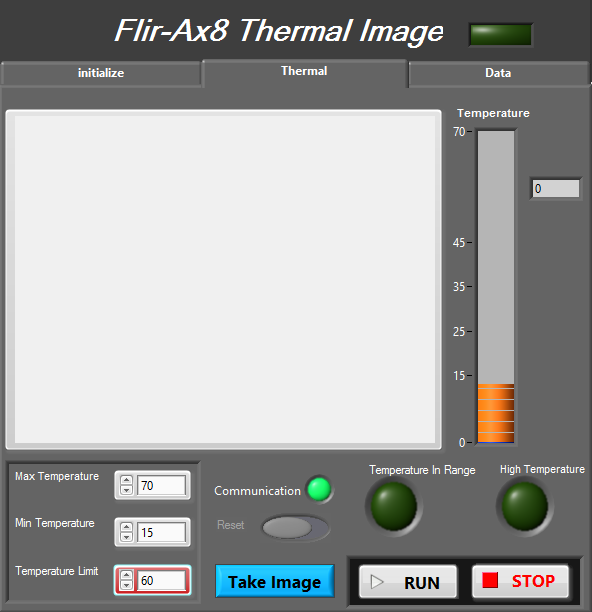
The Thermal window - where the customer receives alerts and control the app.
User Interface
-
The Initialize window - User defines call details, directory for saving data and CSV file name.

-
The Data window - where the events are recorded.

System Operations Tests
-
When the temperature is below the limit.

-
When the temperature is over the limit.
Performance Improvement
-
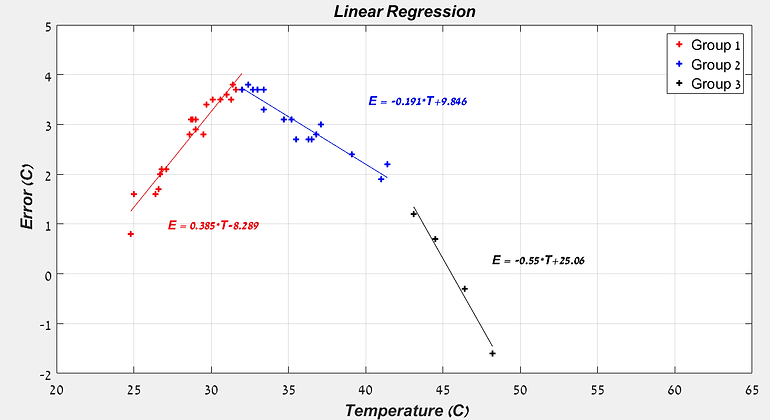
By comparing app performance to other measuring devices it was detected that there is an average error of 2.6 degrees.


-
Calibrate the system using linear regression reduce the average error to 0.5 degrees.
Summary And Conclusions
-
This project is designed to monitor and warn of abnormal heat levels in the FEL-THz accelerator.
-
To test the system, an experiment was done by taking an object at different temperatures.
-
The tests during the project finally led to improved app performance.